The attorneys at Johnson Garcia LLP help injured workers and their families get back on their feet. Need to speak with a work injury lawyer in Houston? Contact us for a free consultation.
Toward a Safer Workplace: Long-Term Statistical Trends
Workers today are safer than their parents and grandparents were. Workplace deaths have declined significantly over the past four decades since the U.S. government established the Occupational Safety and Health Administration (OSHA) in 1970.
- Fast Facts – Long-Term Trends
- Forty years ago, approximately 14,000 U.S. workers died annually.
- As of 2015, that number had dropped to less than 5,000—a decline of almost 36 percent.1
- About 38 workers died every day in 1970.
- About 13 workers died every day in 2015.2
The reason? Stricter regulations, higher standards, and better means of legal redress—all of which have brought the fatality rate down and reduced the prevalence of non-fatal injuries.
If only that were enough.
Far too many workers—almost 3 million per year—still get seriously hurt while putting in a day’s work. If you or your loved one happens to be one of them, contact Johnson Garcia LLP to get help from a Houston work injury lawyer. Only when injured workers fight for their rights are employers held accountable and standards upheld.
- Fast Facts – Fatal Workplace Injuries
- Every day, 150 workers die as a result of hazardous working conditions (based on 2015 numbers).
- 4,836 workers died on the job in the U.S. in 2015.
- The death rate in 2015 totaled 3.4 per 100,000 workers.
- Occupational diseases kill between 50,000 and 60,000 workers each year.3
The Deadliest Jobs in America: Fatality Rate by Industry Sector
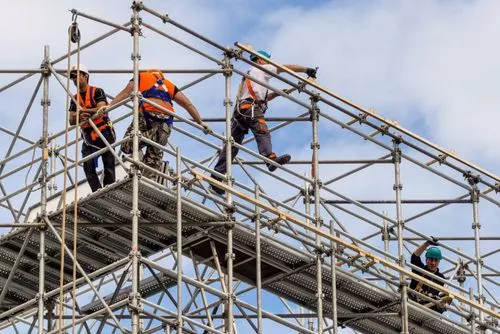
A few sectors of the economy pull in more than their fair share of workplace fatalities every year. When it comes to the total number of deaths, the construction industry tops the list, with 937 fatalities in 2015.
Recent trends aren’t promising, either. In 2015, overall fatalities in the construction industry hit a decades-long peak, rising to pre-recession highs. All told, the industry accounted for one in five workplace deaths—far more than any other sector.
- Fast Facts – Deaths by Industry
- 937 construction workers died on the job in 2015. That accounts for 21.4% of all deaths.
- 765 transportation and warehousing workers died on the job in 2015.
- 570 agriculture, fishing, and forestry workers died on the job in 2015.3
Does that mean construction is the most dangerous work in the country? Hardly. For that, it’s necessary to look at the fatality rate—the number of workers killed compared to the total number of workers in a particular industry.
The construction industry may account for a plurality of all deaths in America, but that’s because it employs so many people. Even the recent increase in construction fatality numbers points more to a recovering economy (more construction means more construction jobs) than to a decline in safety standards.
Instead, it’s the agriculture, fishing, and forestry industries which experienced the highest death rate, at almost 23 per 100,000 workers.
- Fast Facts – Deadliest Industries
- 8 per 100,000 agriculture, fishing, and forestry industry workers died in 2015.
- 8 per 100,000 transportation and warehousing workers died on the job in 2015.3
- Fatal injuries in the private oil and gas extraction industries fell by 38% between 2014 and 2015.4
The Deadliest Activities in America – Fatalities by Event
What is the single deadliest workplace activity? According to the Bureau of Labor Statistics, it’s driving.
Transportation incidents accounted for more than one-quarter of all fatal occupational injuries in 2015, leading to 2,054 deaths. Roadway incidents alone cost 1,264 lives. Nearly 50% of those involved a semi, tanker truck, or tractor-trailer. In other words, no matter what industry a worker is employed in (transportation, construction, sales), vehicles posed the greatest risk to their lives.
- Fast Facts – Deadliest Events
-
- 2,054 deaths were caused by transportation incidents, which represents 26% of all fatal work injuries.
- 800 workers died as a result of falls, slips, and trips.
- 722 people died after coming into contact with objects or equipment.
- 702 workers died because of violence committed by people or animals. 417 of those were homicides.4
The Deadliest Jobs in America: Fatality Rate by Profession
Just as some industries are more dangerous than others, so, too, are some jobs more dangerous than others. Can you guess which ones are the riskiest?
Since transportation accidents were the single deadliest activity, it should come as no surprise that more truck and sales drivers died on the job than workers in any other single profession.
- Fast Facts – Total Fatalities by Occupation
- 885 truck drivers and sales drivers died on the job in 2015.
- 252 farmers, ranchers, and other agricultural managers died.
- 75 roofers died on the job in 2015.4
Once again, take the fatality rate into account, and you get a clearer picture. Calculate fatalities per number of workers, and it’s clear that logging workers face the greatest dangers, with more than 130 deaths per 100,000 workers. That’s more than double the next highest rate, which belonged to fishers and related fishing workers (nearly 55 deaths per 100,000 workers). That makes logging the single deadliest profession in the country.4
- Fast Facts – Fatality Rate by Occupation
- Logging workers suffered a fatality rate of 132.7 per 100,000 workers.
- Fishers and related fishing workers suffered a fatality rate of 54.8 per 100,000 workers.
- Aircraft pilots and flight engineers died at a rate of 40.4 per 100,000 workers.4
Has a loved one died while working? Call Johnson Garcia LLP to find a work injury lawyer in Houston. We help clients file wrongful death suits against employers. As fatality rates decline and standards improve, there’s no excuse for employers who fail to create a safe workplace.
The Deadliest States in America: Geographic Distribution of Injuries and Deaths
Workplace injuries are not evenly distributed across the country. Some states face a much higher rate of injury than others. There could be many reasons for that, from the uneven geographic distribution of certain professions to varying local safety standards.
Where are you most at risk? According to the AFL-CIO, North Dakota tops the list of states with high fatality rates, while Wyoming comes in a close second.
- Fast Facts – Fatality Rate by State
- North Dakota currently has the highest death rate, at 12.5 per 100,000 workers.
- Wyoming comes in second, with 12.0 per 100,000 workers.
- Montana reported a fatality rate of 7.5 per 100,000 workers.
- Mississippi reported a fatality rate of 6.8 per 100,000 workers.
- Arkansas and Louisiana both reported a rate 5.8 deaths per 100,000 workers.3
The Most Dangerous Jobs in America: Non-Fatal Workplace Injuries
Non-fatal injuries have grown less common over time, falling for nearly 13 years in a row. Between 2014 and 2015 alone, the number of non-fatal injuries in the private sector declined by 48,000, a significant decrease for one year. Still, millions of workers suffer non-fatal injuries annually, and many of those face years, if not lifetimes, of recovery.
- Fast Facts – Non-Fatal Workplace Injuries
- The private industry alone experienced 2.9 million non-fatal workplace injuries and illnesses in 2015, the latest year for which there are official statistics.
- Nearly 50% of those involved days away from work, the implementation of work restrictions, or job transfers.
- In 2015, the private sector injury rate was 3.0 per 100 full-time workers.
- During the same period, the public sector injury rate was 5.1 per 100 workers.5
As with fatal injuries, the geographic and sector distribution was uneven, with some places and industries suffering more incidents than others.
- Fast Facts – Distribution of Non-Fatal Injuries
- Maine had the highest injury rate (4.8 per 100 workers) followed by Vermont (4.6 per 100 workers)
- The agriculture, forestry, fishing, and hunting sector had the highest injury rate (5.7 per 100 workers).5
Injured on the job? Be sure to contact a Houston work injury lawyer as soon as possible to start the legal process. Remember: There’s a statute of limitations on personal injury cases. The sooner you get an expert legal team in your corner, the more likely you are to receive compensation.
Johnson Garcia LLP – Helping Workers Move On, Keeping Employers Accountable
What’s responsible for the long-term decline in worker fatality? Over the years, government regulations have become tougher. It has also become easier for people to seek redress through the legal system. Today, injured employees can file a worker’s compensation claim that covers at least part of their medical bills and lost wages.
They can also contact a work injury lawyer in Houston and sue their employers for negligence. That gives businesses a greater incentive to maintain rigorous safety standards, from personal protective equipment to scaffolding requirements. If you’ve been injured on the job or if a loved one has died in the workplace, contact us. We’ll help you explore your legal options and pursue justice.
Sources
- <https://fortune.com/2017/01/25/occupational-safety-workplace-accidents/>
- <https://www.osha.gov/oshstats/commonstats.html>
- <https://aflcio.org/reports/death-job-toll-neglect-2017>
- <https://www.bls.gov/news.release/pdf/cfoi.pdf>
- <https://www.bls.gov/news.release/pdf/osh.pdf>
Need to speak with a work injury lawyer in Houston? Contact us for a free consultation.